
A shopping list that knows what things cost
Type "OJ" and it finds orange juice. For items the Bureau of Labor Statistics tracks, the price change shows next to the name: month over month or year over year, nominal or in today’s dollars.
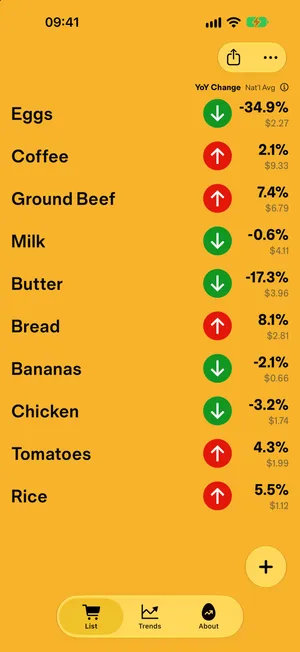
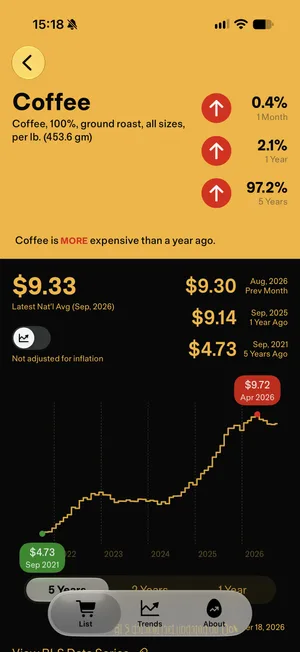
InflataCart puts five years of Bureau of Labor Statistics prices next to every item on your grocery list, so you can see for yourself what is going up, what is not, and by how much. As of September 2026, a pound of coffee averaged $9.33, 2.1% more than a year ago and 97.2% more than five years ago.
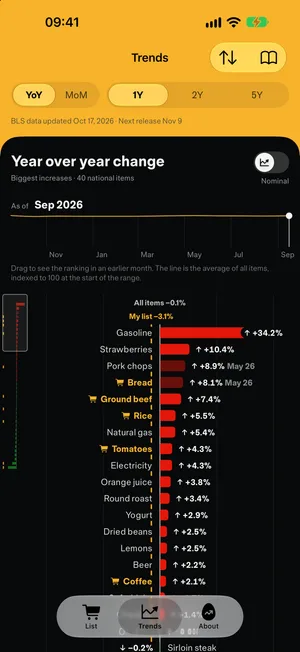
Change from a year ago, U.S. city average
Across the tracked items, prices are down 0.1% from a year ago.
See the full ranking →Type "OJ" and it finds orange juice. For items the Bureau of Labor Statistics tracks, the price change shows next to the name: month over month or year over year, nominal or in today’s dollars.
The Trends board ranks the tracked items by how much their prices changed. Drag back through the months and watch the ranking shift. Items on your own list are marked.
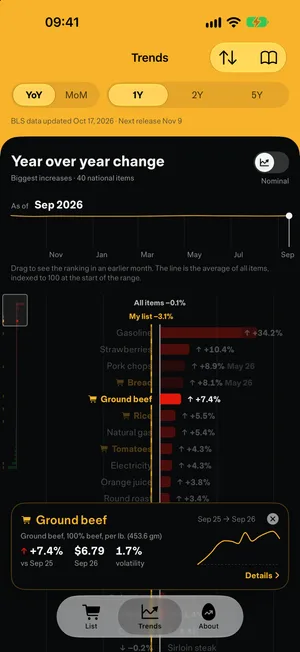
Tap any item for one, two and five year views. Switch to today’s dollars and the answer can change. The high, the low and the months they happened are marked on the line.
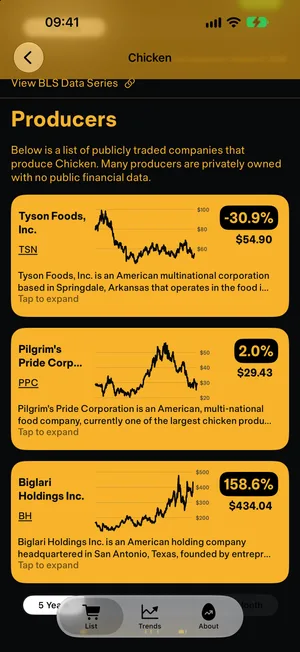
For items made by public companies, see the producer’s stock price next to the grocery price.
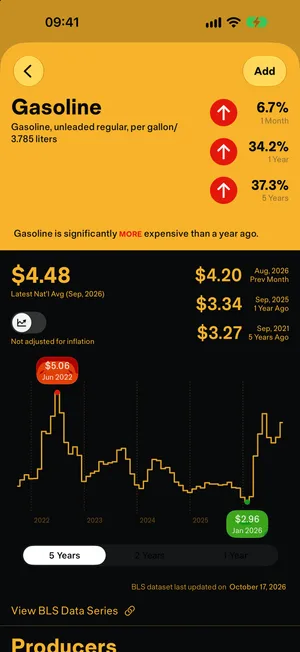
Electricity, gasoline and other household essentials, from the same source, in the same list.
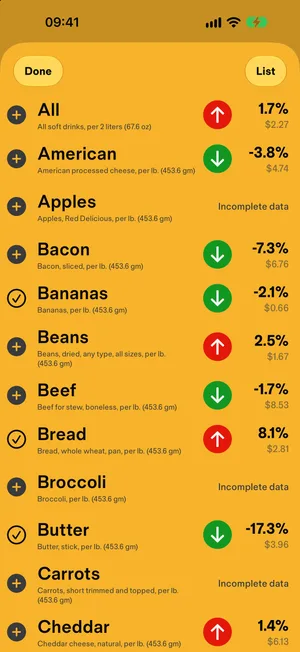
Pick from the pre-loaded BLS items or add your own. Check things off as you shop, share a list as a file, start over.
Average prices from the U.S. Bureau of Labor Statistics, updated every CPI release.
No account, no analytics, no tracking. Your list stays on your device.
InflataCart is a personal project by Wesley Grubbs, made to answer a question he had at the checkout. About →